Reports
Read the reports
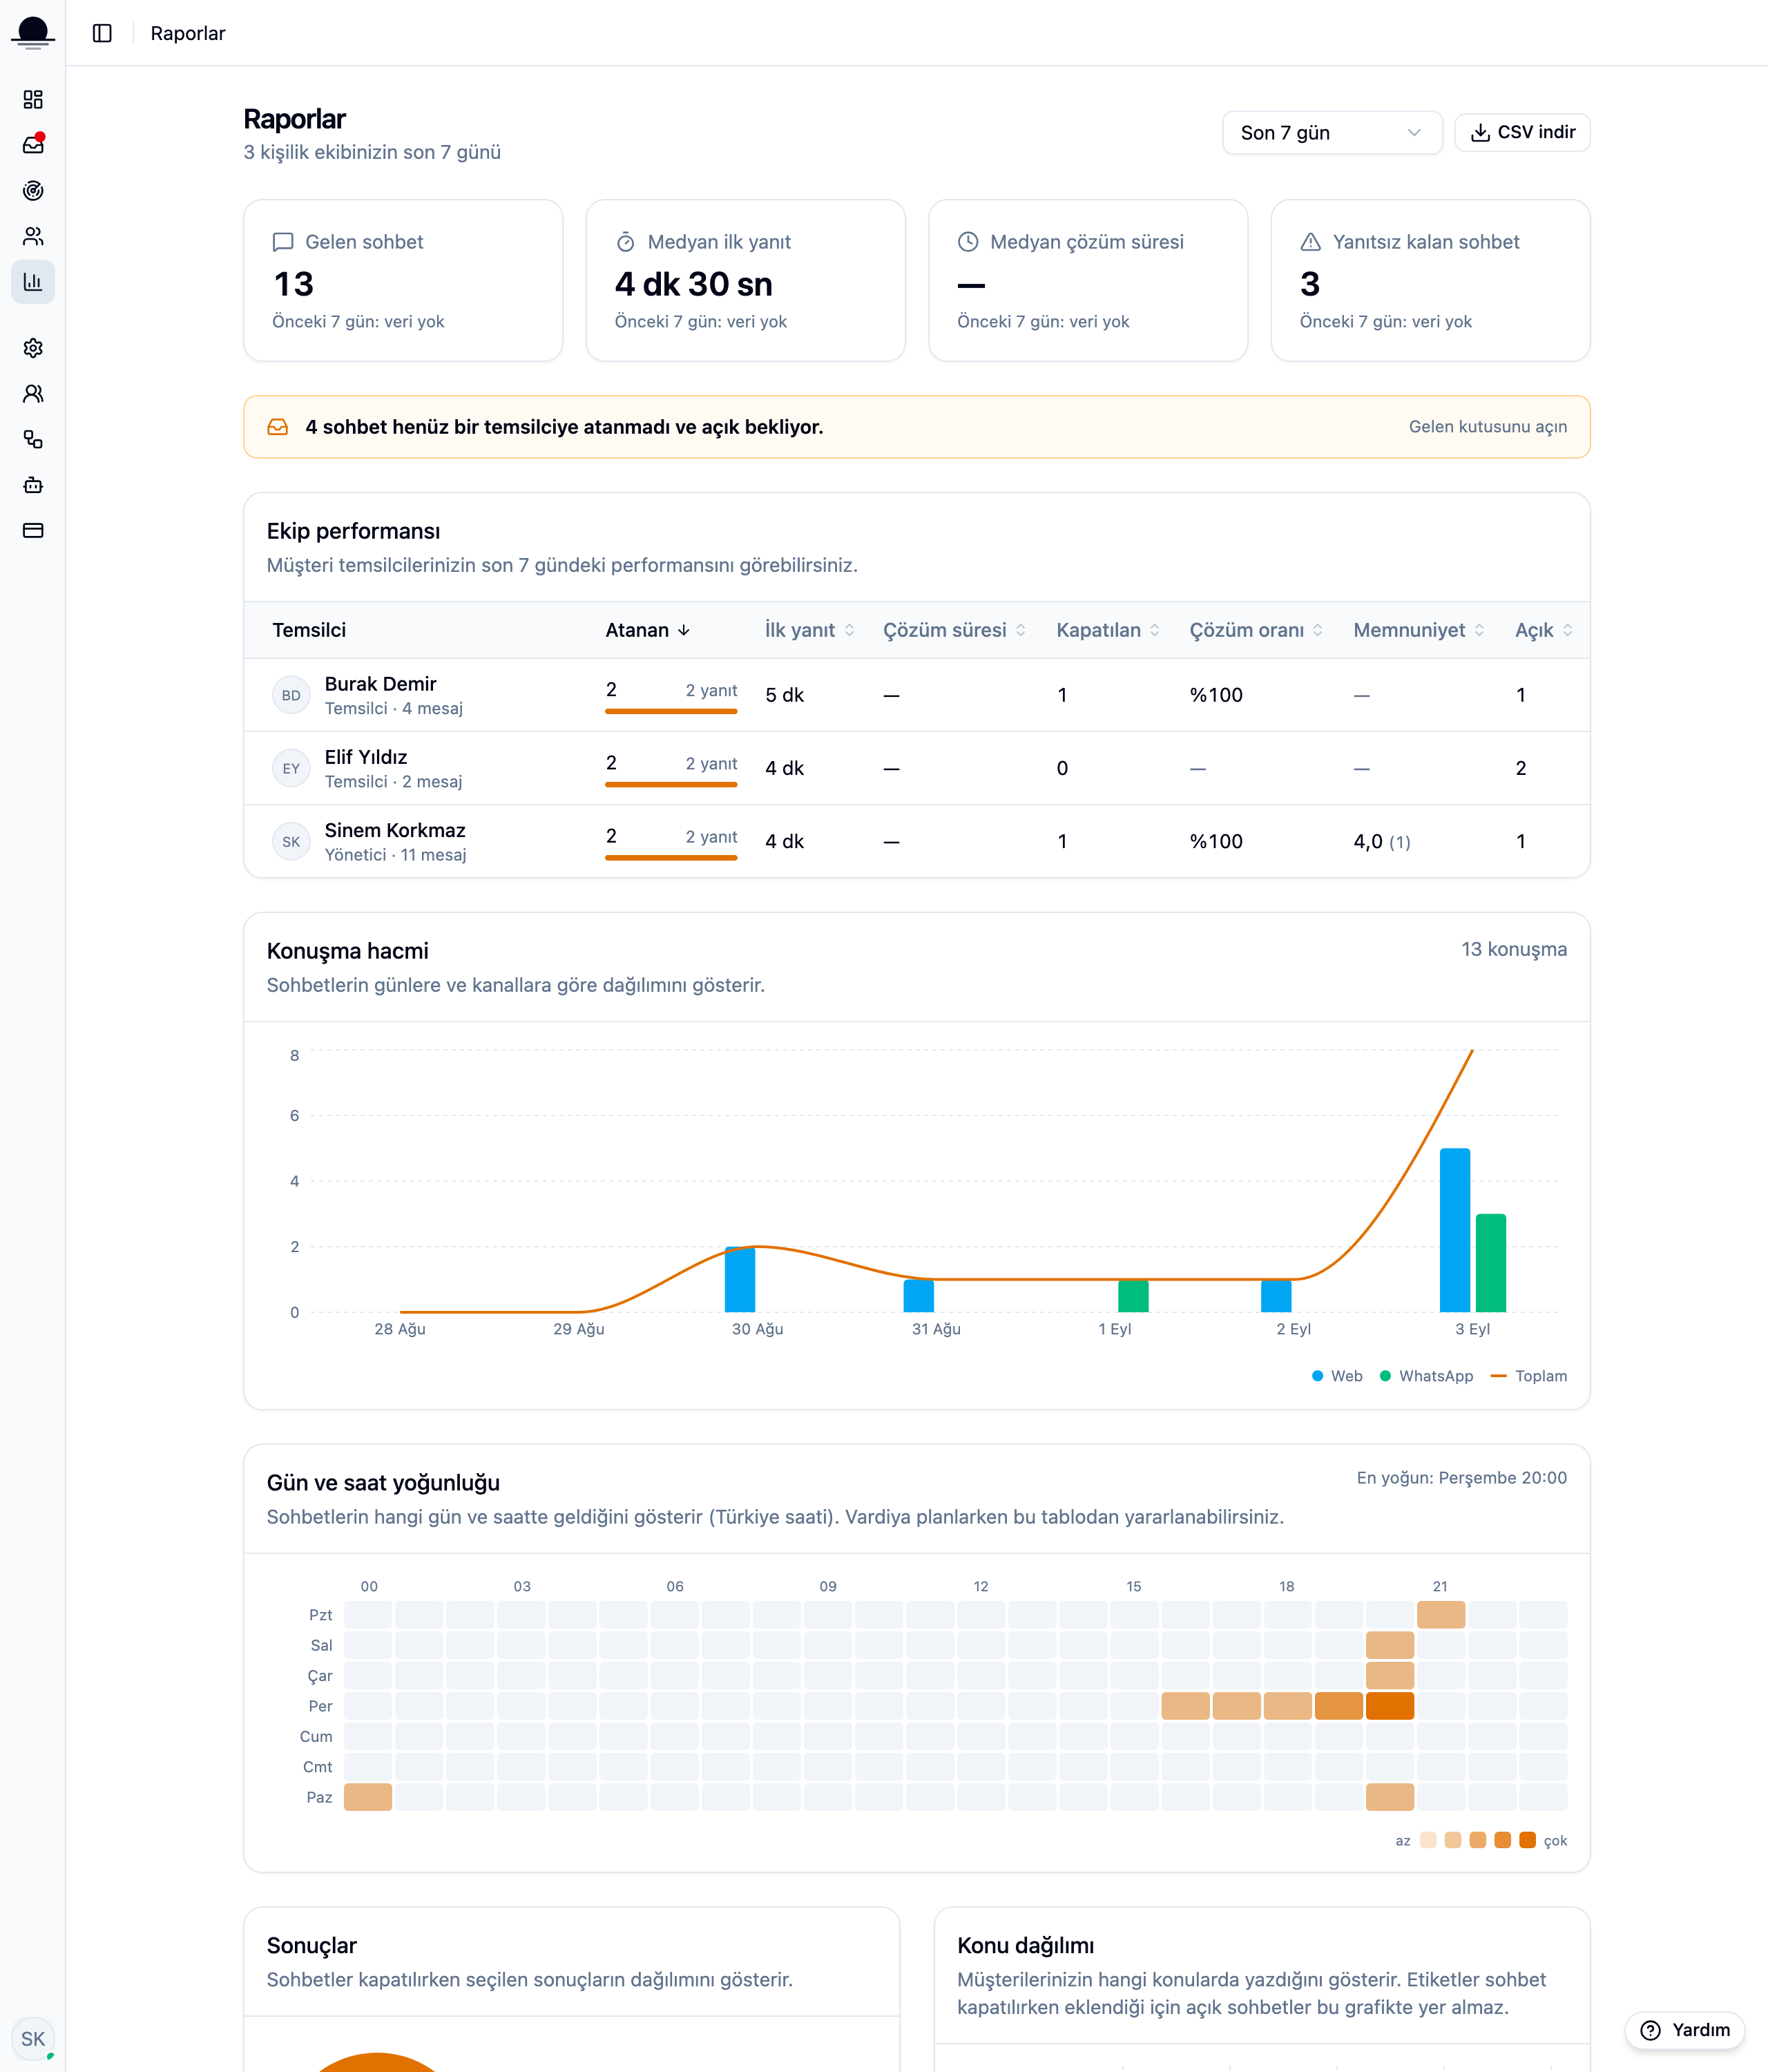
The screen opens with four measures and how each moved against the previous period, then the agent table. Charts sit at the bottom: who did what first, the curve second.
Before you start
- A few days of conversation history
Steps
Pick the range
The list at the top right offers 7 days, 30 days, 90 days, 6 months and 1 year. The arrow under each summary measure compares against the previous period of equal length: pick 7 days and it compares with the 7 days before that.
Read the agent table
Each row is an agent: conversations claimed, conversations answered, median first reply, and how many are still open. Agents with nothing in the range stay in the table, because that is where the difference shows.
If open conversations sit unassigned, a warning appears under the summary and takes you straight to that list. At zero it never shows.
Look at volume and load
The volume chart splits by channel, so you see how much comes from the web and how much from WhatsApp. The heatmap shows which days and hours the messages arrive on, which is where to look when planning shifts.
Get the topics from the tag breakdown
Tags picked at closing add up here. What your customers keep asking shows in this table, and it usually points at what to fix in the product too.
Turn on the satisfaction score
With the switch on in the "Satisfaction" tab of the site settings, the visitor is asked to pick one of five faces once the conversation closes. The Satisfaction card in Reports shows the average, the response rate and how the scores are spread.
Read the response rate before the average: a 2 from three people and a 2 from a hundred are not the same statement.
Frequently asked
Related guides
No account yet?
The free plan covers 2 users and 200 conversations a month. No credit card.